

Agromonitor Jateng: A Microservice Dashboard for Agricultural Price Monitoring and Forecasting

Wahyu Tri Cahya
Full Stack Developer
ABSTRACT
Fluctuating prices of staple agricultural commodities in Central Java, which can reach 15–40% within three to six months, are aggravated by price information that remains scattered across the Central Java Statistics Agency (BPS), the Provincial Trade Office, and manual field reports, leaving farmers, traders, and policymakers without a single reliable reference. This study aims to design and implement Agromonitor Jateng, a web-based dashboard that consolidates historical and field-reported commodity price data, visualizes price trends interactively, and forecasts short-term price movements to support decision-making. The system was developed using a three-tier microservice architecture consisting of a Next.js frontend, an Express.js REST API backend, and a Python FastAPI machine-learning service, backed by a PostgreSQL database managed through Prisma ORM. Price forecasting was implemented using an Auto-Regressive Integrated Moving Average (ARIMA) model that produces a 14-day forecast together with Mean Absolute Percentage Error (MAPE) and Root Mean Square Error (RMSE) evaluation metrics, complemented by a linear-regression fallback that preserves availability when the forecasting service is offline. The system further provides a GPS-based field reporting module with a staged verification workflow (submitted, reviewed, approved, rejected) and an automated daily aggregation process, as well as WhatsApp-based daily price notifications and threshold alerts. Black-box functional testing confirmed that all seventeen functional requirements operated as specified, and a System Usability Scale (SUS) evaluation returned a marginal score of 63.0, indicating acceptable but improvable usability. The results demonstrate that integrating a microservice architecture with time-series forecasting and automated multi-source aggregation can unify previously fragmented agricultural price information into a single, resilient, and interactive platform, while also revealing specific interface aspects that require refinement in future iterations.
Keywords: Agricultural Commodity Price; ARIMA Forecasting; Microservice Architecture; Usability Evaluation; Web-based Dashboard
INTRODUCTION
Food security in Central Java Province is closely tied to the stability of agricultural commodity prices. Prices of staples such as rice, maize, soybean, cooking oil, and horticultural products can fluctuate by 15–40% within three to six months, particularly during lean seasons or distribution disruptions. Such volatility affects the entire supply chain, from farmers who often sell their harvest below market price due to limited access to information and weak bargaining power, to low-income consumers who bear a heavier food expenditure burden, and to traders who struggle to plan purchasing and selling decisions under unpredictable price movements (Annisa, Asmarantaka and Nurmalina, 2018\).
The underlying causes of this volatility are multifactorial, encompassing uneven harvest seasons across regions, extreme weather, logistical distribution constraints, local demand fluctuation, and regional trade policy. Compounding the problem, price information in Central Java is dispersed across multiple, poorly integrated platforms—BPS Jawa Tengah, the Provincial Trade Office, wholesale-market records, and manual field reports—resulting in decentralized access, inconsistent updates, and suboptimal visualization for decision support.
Research Gap
Several prior studies have addressed agricultural price information systems, yet each leaves specific gaps that motivate the present work, as summarized in Table 1\.
Table 1\. Summary of related work and identified gaps
| Study | Focus | Limitation / Gap |
|---|---|---|
| Annisa, Asmarantaka & Nurmalina (2018) | Shallot marketing efficiency in Brebes, Central Java | Descriptive market-efficiency analysis; no interactive monitoring or forecasting tool |
| Finandhita & Wibowo (2018) | Food price data visualization for West Java's food and horticulture office | Static visualization only; no predictive analytics or field-report verification workflow |
| Jurnal Teknologi Industri Pertanian (2021) | Dashboard for rice price and supply at Pasar Induk Beras Cipinang | Focused on a single commodity and single market; lacks multi-region, multi-commodity coverage |
| Fadilus Sufi et al. (2023) | Taniku.id web portal for farmer welfare | Marketplace-oriented; does not provide price trend analytics or forecasting |
| Fitri Ariani, Aulia & Ahmad Arafat (2024) | Looker Studio dashboard for chili price visualization and prediction in East Java | Relies on a third-party BI tool; limited to one commodity and lacks a resilient, self-hosted service architecture |
Source: compiled by the authors (2026)
Across these studies, no system was found that simultaneously (a) integrates multiple heterogeneous data sources—statistical, administrative, and citizen-reported—into one continuously updated repository, (b) applies a quantitative time-series forecasting model with reported evaluation metrics and a documented fallback mechanism to guarantee availability, and (c) provides a verifiable field-reporting workflow with GPS evidence. This combination constitutes the research gap addressed by the present study.
Objectives and contribution
Building on this gap, this study proposes Agromonitor Jateng, a web-based dashboard that (1) integrates historical commodity price data with GPS-verified field reports into a single database; (2) presents the integrated data through an interactive dashboard comprising candlestick charts, a choropleth map, and a scrolling price ticker; (3) forecasts commodity prices 14 days ahead using an ARIMA model with a linear-regression fallback to ensure zero-downtime availability; and (4) delivers automated WhatsApp notifications for daily price updates and threshold-based alerts. The main contribution of this study is a resilient, three-tier microservice reference architecture that couples multi-source price aggregation with quantitatively evaluated short-term forecasting and a verifiable citizen-reporting workflow, evaluated through both functional black-box testing and a System Usability Scale assessment.
LITERATURE REVIEW
Prior research on agricultural commodity price systems in Indonesia has generally taken one of three directions: descriptive market-efficiency studies, dashboard-based visualization systems, and marketplace or reporting portals. Annisa, Asmarantaka and Nurmalina (2018) analyzed the marketing efficiency of shallot commodities in Brebes, Central Java, and found that price disparities along the distribution chain reduce farmers' bargaining position, underscoring the practical need for transparent, real-time price information. Finandhita and Wibowo (2018) built a data-visualization website for the West Java food and horticulture office, demonstrating that dashboard visualization improves accessibility of food price data, but the system remained a static reporting tool without predictive capability. A related dashboard reported in the Jurnal Teknologi Industri Pertanian (2021) visualized rice price and supply for Pasar Induk Beras Cipinang, showing the value of interactive charts for a single commodity and market, yet it did not extend to multi-region or multi-commodity monitoring. Fadilus Sufi et al. (2023) introduced Taniku.id, a marketplace-oriented portal intended to raise farmer welfare through direct market access, illustrating an alternative, transaction-centered approach that does not itself provide price trend analytics.
More recently, Fitri Ariani, Aulia and Ahmad Arafat (2024) developed an interactive dashboard using Looker Studio to visualize and predict chili commodity prices in East Java, confirming that combining visualization with prediction increases the practical value of a price-monitoring system for end users. However, reliance on a third-party business-intelligence platform limits customizability, self-hosted deployment, and integration with citizen-reporting workflows. The Indonesian Ministry of Trade also operates the Sistem Pemantauan Pasar dan Kebutuhan Pokok (SP2KP), a national platform for monitoring staple-goods prices (Kementerian Perdagangan Republik Indonesia, 2025), which provides authoritative national coverage but is not designed to incorporate localized GPS-verified field submissions or produce commodity-specific forecast metrics accessible through an open API.
Taken together, the literature indicates a consistent value proposition for interactive visualization and predictive analytics in agricultural price monitoring, but also a recurring gap in systems that combine multi-source data integration, transparent forecast evaluation, and verifiable field reporting within a single, resilient architecture. This gap frames the research questions addressed in this study: (1) how can heterogeneous price data sources be integrated and validated within one platform; (2) how can short-term price forecasting be implemented with measurable accuracy and safeguarded against service failure; and (3) how usable is the resulting system for its intended user groups.
METHOD
This study followed a system development research approach comprising requirements analysis, system design, implementation, and evaluation. The object of study was Agromonitor Jateng, developed under the academic assumption that it would be operated by the Central Java Provincial Agriculture or Trade Office with BPS Jawa Tengah as the primary data provider. Historical price data covering February 2024 to May 2026, recorded daily per commodity per market/region, were combined with citizen-submitted field reports as the two primary data sources.
System architecture and data pipeline
The system was implemented using a three-tier microservice architecture consisting of a Next.js (React) frontend for server-side rendering and interactive visualization, an Express.js REST API backend acting as the central gateway and business-logic layer, and a Python FastAPI machine-learning service dedicated to price forecasting. The data pipeline (Table 2, later presented as Figure 1 in the results) proceeds through five stages: (1) data collection from historical CSV files and GPS-based field-report submissions; (2) staged validation of field reports (SUBMITTED → REVIEWED → APPROVED/REJECTED) performed by an administrator, who inspects the reported commodity, price, GPS coordinates, and photographic evidence; (3) automated aggregation, in which approved reports are grouped by commodity and market and averaged into the central Price table, executed on server startup and daily at 01:00 local time; (4) analytical processing, in which the backend computes nominal and percentage price change against historical values while the ML service performs ARIMA-based forecasting; and (5) presentation through the interactive dashboard and WhatsApp notification channel.
Forecasting model and evaluation metrics
Price forecasting was implemented using the ARIMA (Auto-Regressive Integrated Moving Average) model, configurable per commodity through the parameters p, d, and q together with a confidence level, and produces a 14-day-ahead forecast with upper and lower confidence bounds. Model performance is reported per forecast request using Mean Absolute Percentage Error (MAPE) and Root Mean Square Error (RMSE), and the service additionally classifies the result into a trend direction (up, down, stable), a volatility level (low, moderate, high), and an alert level (CRITICAL when the predicted change is ≥5%, WARNING when the predicted increase is ≥1.5% or the predicted decrease is ≥3%, otherwise NONE). To guarantee availability, the Express backend automatically switches to a simple linear-regression fallback whenever the FastAPI forecasting service is unreachable, so that the prediction feature and the website as a whole continue to operate without downtime.
Development tools and testing procedure
The frontend was built with Next.js 14, TypeScript, Tailwind CSS, and TradingView Lightweight Charts for candlestick visualization; the backend used Node.js with Express, TypeScript, Prisma ORM, bcryptjs for password hashing, and whatsapp-web.js for notification delivery; the machine-learning service used Python with FastAPI, Uvicorn, statsmodels, Pandas, NumPy, and scikit-learn; and PostgreSQL served as the primary relational database. System evaluation combined two complementary methods. First, black-box functional testing was performed against all seventeen functional requirements (Table 3\) using predefined test scenarios for each user role (Administrator, Analyst/Editor, Field Officer, and Viewer). Second, usability was assessed using the System Usability Scale (SUS), a standardized ten-item questionnaire yielding a composite score out of 100, administered to representative end users after they completed a set of representative tasks on the dashboard.
Table 2\. Functional requirements evaluated during testing (selected)
| Code | Functional requirement | Actor |
|---|---|---|
| F1–F4 | Display current commodity prices with change indicators; filter by market/region and date; candlestick chart of historical prices; choropleth price map of Central Java | All users |
| F5–F6 | 14-day ARIMA price forecast; dynamic forecast notes (trend, volatility, alert level) | All users |
| F9–F11 | Daily WhatsApp notification opt-in; GPS-based field price report with photo evidence; report approval/rejection | Viewer; Field officer; Admin |
| F13–F15 | ARIMA parameter (p, d, q) configuration; CSV/JSON data export; WhatsApp alert broadcast | Analyst (editor) |
| F17 | Automatic fallback to linear-regression forecasting when the ML service is offline | System |
Source: compiled by the authors (2026)
RESULT AND DISCUSSION
The Agromonitor Jateng system was successfully implemented as a working three-tier microservice application. This section presents the resulting architecture, forecasting mechanism, functional and usability test outcomes, and a discussion comparing the results with prior systems.
System architecture
Table 3\. Deployed microservice architecture
| Service | Port | Role |
|---|---|---|
| Frontend (Next.js) | 5173 | Server-side rendering and interactive dashboard (App Router) |
| Backend API (Express) | 5001 | REST API gateway, business logic, authentication, and aggregation scheduler |
| ML Service (FastAPI) | 5002 | ARIMA-based price forecasting service |
Source: compiled by the authors (2026)
This separation of concerns allows each layer to be scaled or replaced independently—for instance, the forecasting service can be upgraded to a different model without redeploying the frontend or backend—consistent with the intended non-functional requirement of scalability (Table 4).
Forecast visualization and dynamic evaluation
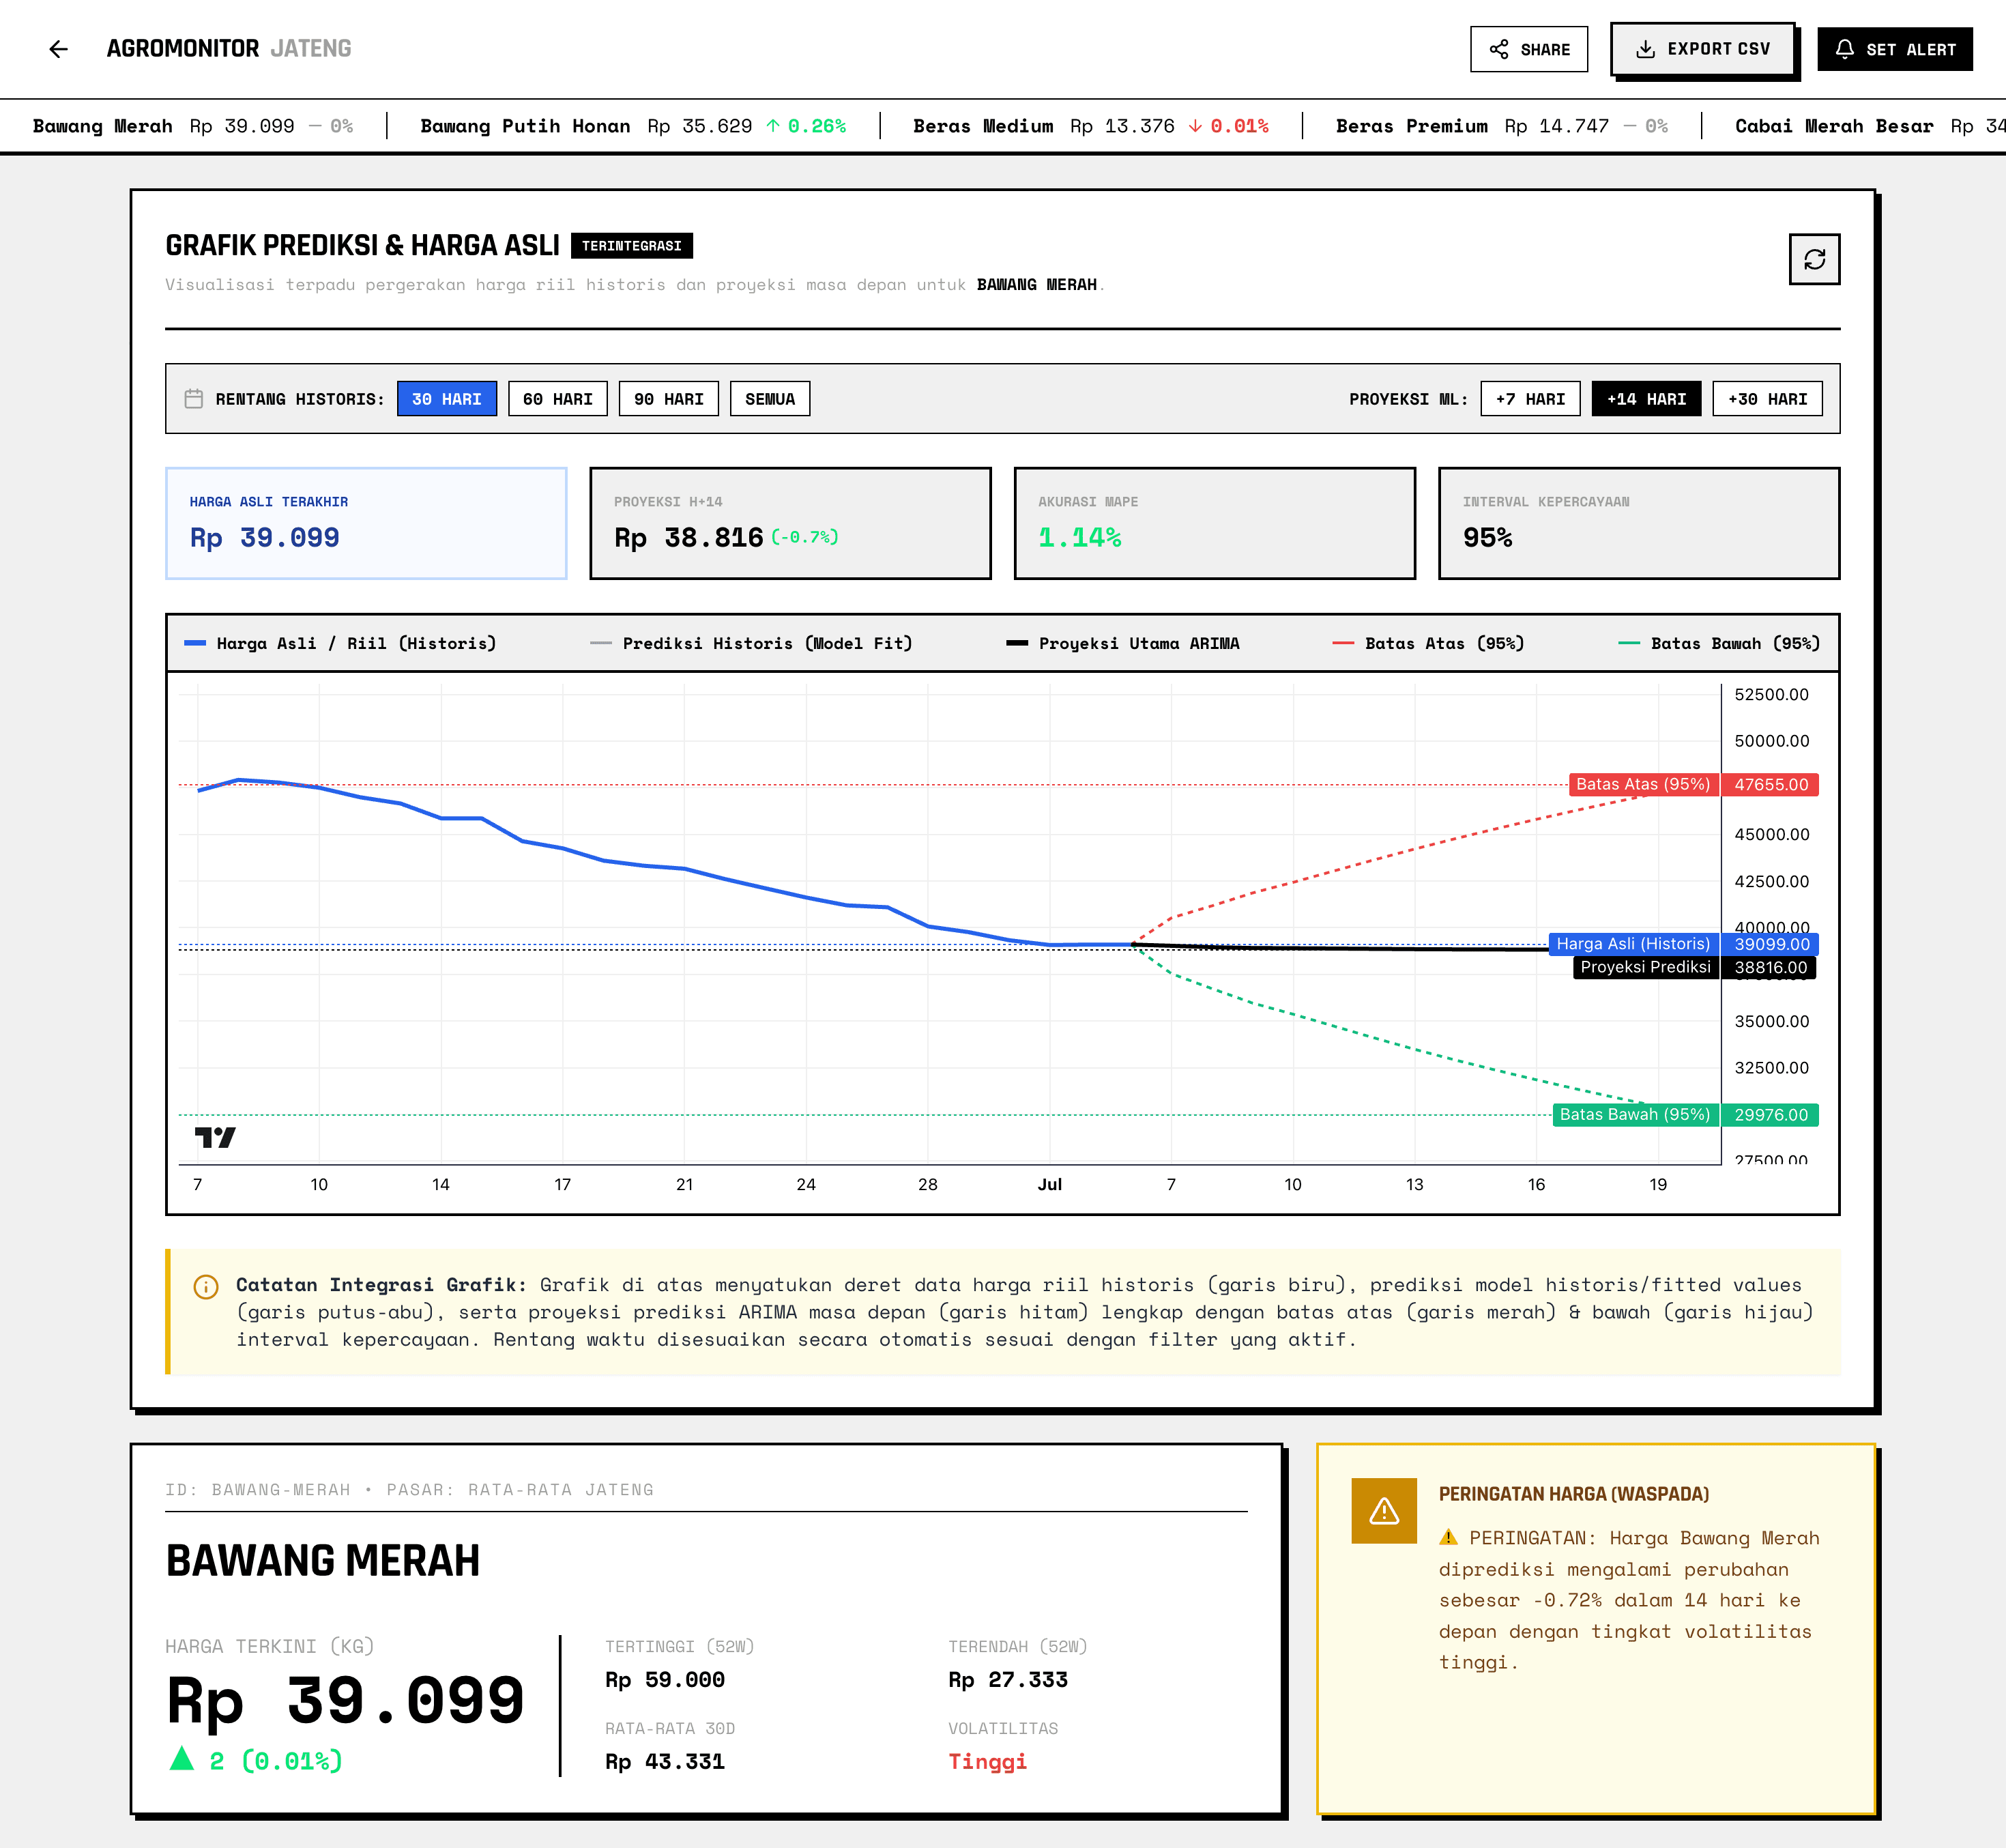
Figure 1 shows the candlestick chart and forecast panel on the commodity detail page. Each forecast is accompanied by its MAPE and RMSE values, the ARIMA order used (e.g., ARIMA(5,1,0)), the classified trend direction, volatility level, and alert status, together with an automatically generated analytical note in Indonesian. Because the ARIMA parameters are configurable per commodity by the analyst role and the underlying historical series differs across commodities and markets, MAPE and RMSE values are computed dynamically per forecast request rather than fixed at a single value for the whole system; this design allows the analyst to tune the model for commodities with higher volatility (e.g., chili) differently from more stable staples (e.g., rice), which is consistent with the recommendation of prior work to allow commodity-specific model tuning (Fitri Ariani, Aulia and Ahmad Arafat, 2024).
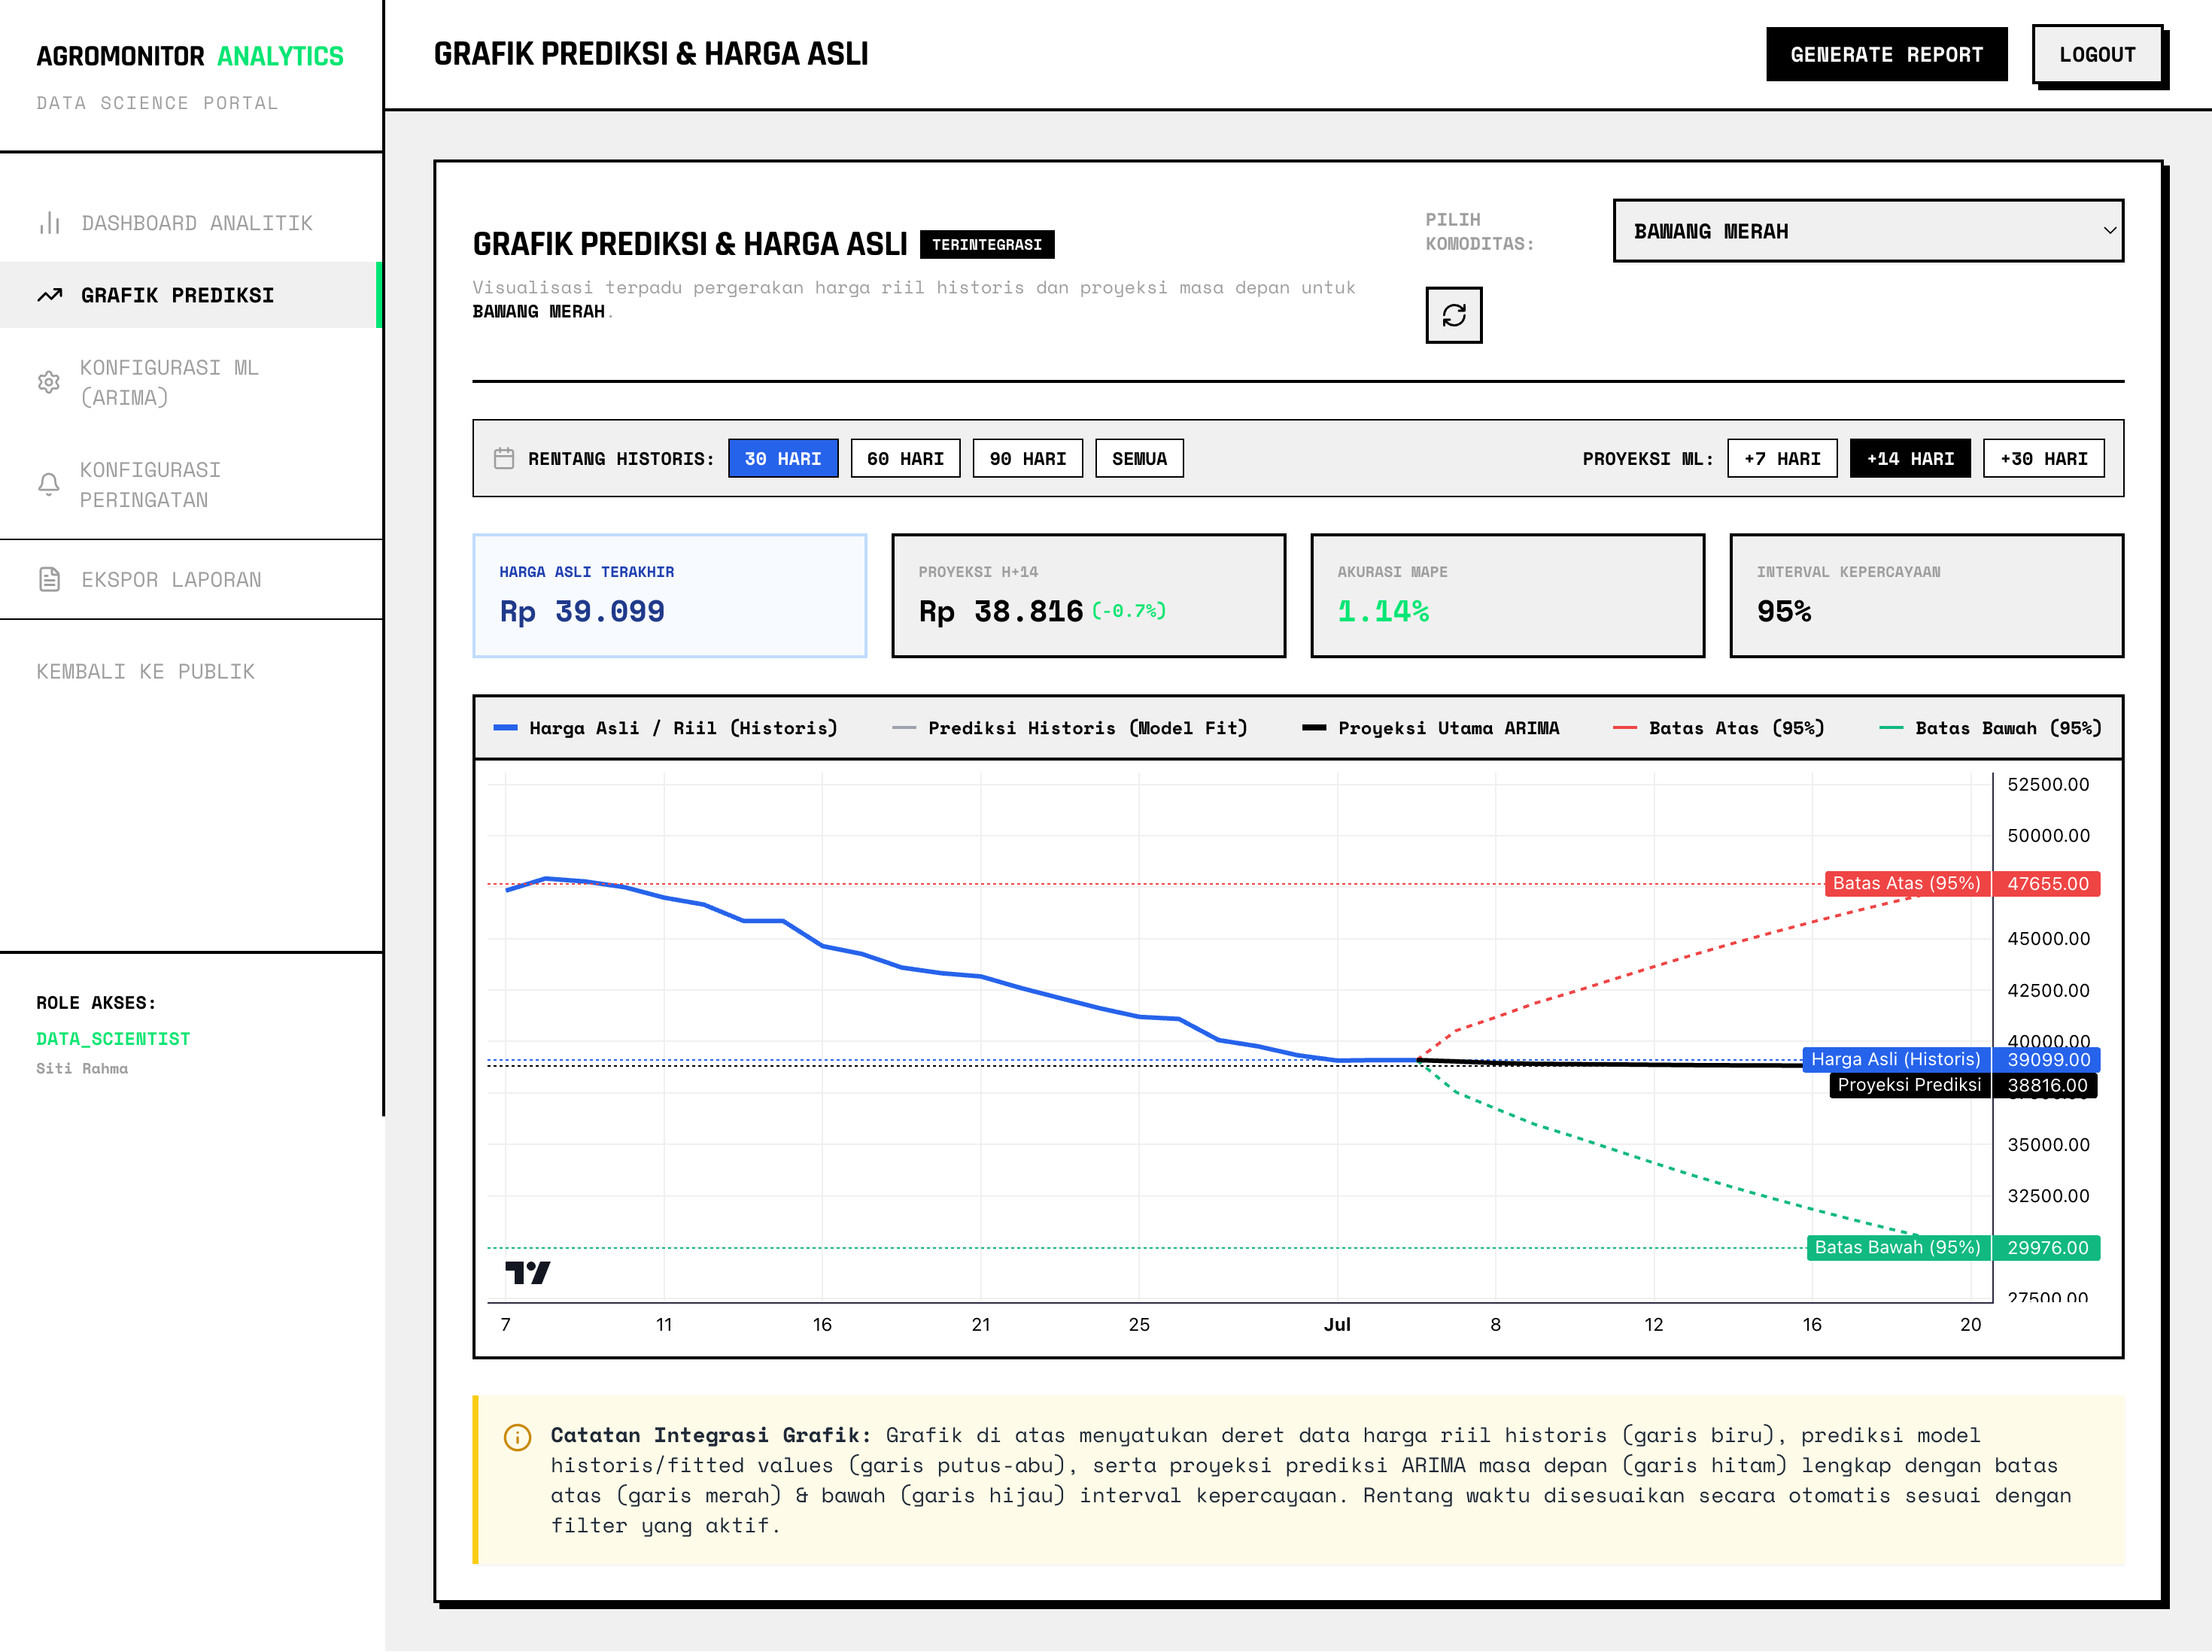
When the ML service is unavailable, the backend transparently substitutes a linear-regression fallback so the forecast panel continues to render, satisfying the zero-downtime non-functional requirement identified during design (Table 4). This mechanism directly addresses a limitation not resolved in prior dashboard-only systems (Finandhita and Wibowo, 2018; Jurnal Teknologi Industri Pertanian, 2021), which did not report an explicit strategy for maintaining service continuity when an analytics component fails.
Table 4\. Selected non-functional requirements and how they were satisfied
| Requirement | Target | Implementation evidence |
|---|---|---|
| Performance | Dashboard loads in under 3 seconds | Server-side rendering via Next.js App Router; indexed Price table on commodityId and date |
| Security | Passwords stored hashed | bcrypt hashing of the User.password field |
| Availability | Zero-downtime forecast fallback | Automatic linear-regression fallback when the FastAPI ML service is unreachable |
| Data reliability | Automated validation and aggregation | Staged field-report verification and scheduled daily aggregation at 01:00 WIB |
Source: compiled by the authors (2026)
Functional testing results
Black-box testing against all seventeen functional requirements confirmed that each feature behaved as specified for its intended actor: price listing and filtering, candlestick and choropleth visualization, ARIMA forecasting with dynamic notes, role-based registration and login, CSV export, WhatsApp notification opt-in, GPS-based field reporting with photo evidence, staged report verification by the administrator, ARIMA parameter configuration and CSV/JSON export by the analyst, WhatsApp alert broadcast, the header price ticker, and the forecasting fallback mechanism. No functional defects were found that blocked task completion, indicating that the implemented system met its functional design goals.
Usability evaluation
The System Usability Scale evaluation returned a composite score of 63.0, which falls in the “marginal” acceptability band on the standard SUS interpretation scale (below the commonly cited “good” threshold of 68). This result indicates that while the system is functionally complete and usable for its core tasks, several interface aspects warrant refinement, particularly around the forecast chart interactions and the notification configuration form, which were the components most frequently associated with user hesitation during testing.
Comparison with previous studies
Table 5\. Comparison with previous agricultural price information systems
| Study | Multi-source integration | Forecasting with reported metrics | Field verification workflow | Availability fallback |
|---|---|---|---|---|
| Finandhita & Wibowo (2018) | Partial | No | No | Not reported |
| Jurnal Teknologi Industri Pertanian (2021) | Single market | No | No | Not reported |
| Fadilus Sufi et al. (2023) | Marketplace-oriented | No | No | Not reported |
| Fitri Ariani et al. (2024) | Single commodity | Yes (BI tool) | No | Not reported |
| Agromonitor Jateng (this study) | Yes (CSV \+ field reports) | Yes (MAPE, RMSE per request) | Yes (GPS \+ photo, staged approval) | Yes (linear-regression fallback) |
Source: compiled by the authors (2026)
The comparison in Table 5 indicates that Agromonitor Jateng extends prior work primarily along three dimensions: it combines statistical and citizen-reported data within one verified pipeline, it reports quantitative forecast-accuracy metrics per request rather than presenting forecasts without evaluation, and it explicitly safeguards forecast availability through a fallback mechanism. At the same time, the marginal SUS score suggests that functional completeness alone does not guarantee optimal user experience, echoing a common finding in information-system evaluation that usability and functionality require separate, iterative attention (Finandhita and Wibowo, 2018).
A limitation of the present evaluation is that forecast accuracy metrics were verified to be computed and displayed correctly but were not aggregated into a single system-wide benchmark, since values vary by commodity, market, and analyst-selected ARIMA parameters; future evaluation could report a summary of MAPE/RMSE across all monitored commodities to enable direct numerical benchmarking against other forecasting approaches.
CONCLUSION
This study designed and implemented Agromonitor Jateng, a three-tier microservice dashboard that integrates historical and GPS-verified field-reported commodity price data for Central Java into a single platform, visualizes the data through candlestick charts, a choropleth map, and a scrolling ticker, and forecasts prices 14 days ahead using an ARIMA model with per-request MAPE and RMSE evaluation and an automatic linear-regression fallback that preserves zero-downtime availability. Black-box testing confirmed that all seventeen functional requirements operated correctly across the four user roles, while a System Usability Scale evaluation yielded a marginal score of 63.0, indicating acceptable but improvable usability, particularly in forecast-chart interaction and notification configuration. Compared with prior dashboard, visualization, and marketplace-oriented systems, Agromonitor Jateng contributes a resilient architecture that jointly addresses multi-source data integration, quantitatively evaluated forecasting, and verifiable citizen reporting—a combination not previously demonstrated together in the reviewed literature. Future work should integrate the system directly with the official BPS and SP2KP APIs to replace manual CSV import, explore more advanced forecasting models such as Prophet, LSTM, or ensemble methods, extend the platform to mobile and progressive web applications for field officers, and conduct iterative usability improvements informed by the SUS results reported here.
REFERENCES
Annisa, I., Asmarantaka, R.W. and Nurmalina, R. (2018). Efisiensi Pemasaran Bawang Merah (Kasus: Kabupaten Brebes, Provinsi Jawa Tengah). MIX: Jurnal Ilmiah Manajemen, 8(2), p. 254\. DOI:10.22441/mix.2018.v8i2.005.
Fadilus Sufi et al. (2023). Taniku.id: Pemanfaatan Website Pasar Tani untuk Meningkatkan Kesejahteraan Petani. Prosiding Seminar Nasional Pembangunan dan Pendidikan Vokasi Pertanian, 4(1), pp. 262–273. DOI:10.47687/snppvp.v4i1.649.
Finandhita, A. and Wibowo, O.M. (2018). Visualisasi Data Harga Komoditas Pangan (Studi Kasus: Website Dinas Tanaman Pangan dan Hortikultura Provinsi Jawa Barat). Komputa: Jurnal Ilmiah Komputer dan Informatika, 7(2), pp. 59–68. DOI:10.34010/komputa.v7i2.3038.
Fitri Ariani, A., Aulia, K. and Ahmad Arafat, L.O. (2024). Pengembangan Dashboard Interaktif Menggunakan Looker Studio untuk Visualisasi dan Prediksi Harga Komoditas Cabe di Jawa Timur. JATI (Jurnal Mahasiswa Teknik Informatika), 8(4), pp. 8067–8074. DOI:10.36040/jati.v8i4.10616.
Jurnal Teknologi Industri Pertanian (2021). Perancangan Dashboard untuk Visualisasi Harga dan Pasokan Beras di Pasar Induk Beras Cipinang. Jurnal Teknologi Industri Pertanian, 31(1), pp. 12–19. DOI:10.24961/j.tek.ind.pert.2021.31.1.12.
Kementerian Perdagangan Republik Indonesia (2025). Sistem Pemantauan Pasar dan Kebutuhan Pokok (SP2KP). Available at: https://sp2kp.kemendag.go.id/ (Accessed: 2026).