


Price Prediction, LSTM, XGboost, Hybrid Stacking•25 Sep 2026
A Comparative Performance Analysis of Long Short-Term Memory (LSTM), eXtreme Gradient Boosting (XGBoost), and Hybrid Stacking Models in Predicting BBRI Stock Prices (2015–2025)

Wahyu Tri Cahya
Full Stack Developer
16 min read
Abstract
Daily stock price prediction is a critical but challenging topic in financial research due to the volatile, non-linear, and noisy nature of stock market data. This study presents a comparative analysis of a deep learning model, Long Short-Term Memory (LSTM) Baseline, a machine learning model, eXtreme Gradient Boosting (XGBoost) Baseline, and a two-level Hybrid Stacking model (LSTM → XGBoost) in predicting the daily closing price of PT Bank Rakyat Indonesia (Persero) Tbk (BBRI) shares from January 1, 2015, to December 31, 2025. To ensure results stability and avoid statistical fluke, the experiments were run 10 times under controlled environments with 10 different random seeds. The evaluation results demonstrate that the XGBoost Baseline consistently produces the lowest error rates with an average MAE of 126.1506 ± 4.5945 IDR, RMSE of 188.5673 ± 4.0398 IDR, $R^2$ Score of 0.8412 ± 0.0068, and MAPE of 3.1385% ± 0.1263%. The Hybrid Stacking model shows competitive performance but fails to outperform the XGBoost baseline ($R^2$ = 0.8323 ± 0.0095), while the LSTM Baseline yields the lowest performance ($R^2$ = 0.5901 ± 0.0808). Statistical testing using the Wilcoxon Signed-Rank Test on residual errors confirms that the performance differences among the three models are statistically significant (p-value < 0.05). These findings suggest that decision tree-based ensemble models (XGBoost) combined with proper technical indicators and autoregressive lag features are more robust and stable than pure deep learning models for high-volatility stock prediction.Keywords: Stock Prediction, BBRI, LSTM, XGBoost, Hybrid Stacking, Wilcoxon Test.
1. Introduction
The Indonesian capital market has grown rapidly alongside the increasing investment awareness of the public. One of the most popular investment instruments on the Indonesia Stock Exchange (IDX) is BBRI, a large-capitalization state-owned enterprise (BUMN) banking stock. The movement of BBRI stock price represents financial time-series data influenced by various local and global economic dynamics. Accurate stock price prediction is highly beneficial for investors and financial institutions to minimize investment losses and optimize portfolio returns.However, stock price time-series data is characterized by high volatility, noise, and complex non-linear relationships. Conventional parametric statistical methods, such as ARIMA, often fail to model these non-linear trend shifts accurately. Consequently, researchers have begun to apply machine learning and deep learning techniques. In the literature, it is often assumed that sophisticated deep learning models like Long Short-Term Memory (LSTM) or complex Hybrid Stacking models will automatically outperform conventional machine learning models based on tabular data.
Several studies claim the superiority of pure LSTM deep learning models for predicting individual stocks and market indices [5, 6, 9]. Conversely, decision tree-based models such as XGBoost have proven to be highly robust in various tabular and sequential regression tasks [1, 4]. On the other hand, some researchers have proposed hybrid models that combine LSTM predictions with decision tree algorithms to mitigate the weaknesses of each model [7, 8]. Nevertheless, uncertainty remains in the literature regarding whether more complex models (such as Hybrid Stacking) consistently provide genuine performance advantages, especially when tested under volatile and noisy local capital market conditions. The majority of previous studies also rely on single-run experiments, which are prone to parameter initialization bias (cherry-picking), and rarely include paired statistical significance tests to validate performance differences.
This study aims to address this literature gap by conducting a rigorous comparative analysis of the LSTM Baseline, XGBoost Baseline, and Hybrid Stacking (LSTM → XGBoost) models for predicting the daily closing price of BBRI stock over a 10-year span (2015–2025). The experiments were conducted for 10 independent runs with dynamic random seeds to ensure statistical stability of the results. The significance of performance differences was evaluated using the Wilcoxon Signed-Rank Test at a 95% confidence level. This research formulates three main Research Questions (RQs):
1. RQ1: How do the predictive accuracies of the LSTM Baseline, XGBoost Baseline, and Hybrid Stacking models compare based on evaluation metrics such as MAE, RMSE, MAPE, and the goodness-of-fit $R^2$ Score on the BBRI stock test set?
2. RQ2: Are the performance differences among the three models statistically significant?
3. RQ3: What factors contribute to the failure of pure deep learning models or hybrid models to outperform simpler machine learning models under specific market conditions?
2. Literature Review
* Financial Time-Series Prediction: The characteristics of capital market data, which feature a high noise-to-signal ratio, make it one of the greatest challenges in computational finance. Rosyd et al. [6] evaluated the use of LSTM models for BBCA stock during the 2020–2023 period and reported reasonably good performance. Alkayes & Sugihartono [5] compared XGBoost and LSTM on Tesla stock, concluding that LSTM provided higher accuracy. Meanwhile, Ulya et al. [9] compared both for Bitcoin and found that XGBoost was prone to overfitting compared to LSTM. Conversely, Indriyanti & Fajriah [10] reported the success of LSTM in minimizing forecasting errors for solar radiation compared to XGBoost. This demonstrates that model superiority is domain-specific. * Long Short-Term Memory (LSTM): First introduced by Hochreiter & Schmidhuber [11], LSTM is a recurrent neural network (RNN) deep learning architecture specifically designed to store long-term historical information while mitigating the vanishing gradient problem. LSTM processes sequential data temporally using a cell state structure and three main gates (input, forget, and output gates). This method has been widely implemented on sequential commodity and weather data, such as forecasting rice prices in Central Java [3]. * eXtreme Gradient Boosting (XGBoost): Introduced by Chen & Guestrin [12], XGBoost is a decision-tree-based ensemble learning algorithm optimized with gradient boosting techniques. XGBoost is highly robust for structured tabular data due to its fast convergence, automatic handling of missing values, and internal regularization (L1 and L2) to prevent overfitting. Its reliability has been demonstrated across various prediction and classification domains, including disease case prediction [1] and phishing URL detection [4]. * Hybrid Stacking: An ensemble method where predictions from one or more base models (Level 1) are incorporated as additional features alongside the original data to train a model at the next level (Level 2), which acts as a meta-learner [13]. Kevin et al. [8] applied a hybrid LSTM-XGBoost model to predict the exchange rate of the Indonesian Rupiah against the US Dollar, while Aprilia et al. [7] used a similar combination specifically for BBRI stock and reported that the hybrid model's performance outperformed single models. * Wilcoxon Signed-Rank Test: A non-parametric paired statistical test used to compare the median differences in residual errors between models. This test is crucial because financial time-series data often violates normality assumptions (as shown by Kolmogorov-Smirnov test results on model residuals), rendering parametric tests like the paired t-test invalid.3. Research Methodology
The methodology workflow of this study is systematically designed to ensure full reproducibility.3.1. Data Collection and Cleansing
The dataset consists of the daily stock prices of PT Bank Rakyat Indonesia (Persero) Tbk (BBRI) from January 1, 2015, to December 31, 2025, downloaded automatically via the Yahoo Finance API (yfinance). The dataset contains a total of 2,726 trading rows. The acquired data was subsequently cleansed of missing values (null values).3.2. Feature Engineering
To provide rich temporal and volatility representations for the models, we extracted 65 input features: 1. Autoregressive Lag Features: 60 days of historical closing prices (Lag_Close_t-1 to Lag_Close_t-60). 2. Technical Indicators: 20-day Simple Moving Average (SMA_20) and 50-day Exponential Moving Average* (EMA_50) to capture short- and medium-term price trends. 14-day Relative Strength Index* (RSI_14) to capture overbought or oversold conditions. Moving Average Convergence Divergence* (MACD) to detect shifts in price momentum. 14-day Average True Range* (ATR_14) to explicitly model daily market volatility.3.3. Data Preprocessing and Splitting
All input features were scaled using aMinMaxScaler to the range [0, 1] based on the training data statistics to prevent feature scale bias. The dataset split was performed chronologically (without random shuffling to preserve temporal sequence) with a proportion of 80% for the training set (period 2015–2023) and 20% for the testing set (period 2024–2025).
3.4. Model Architecture Specification
* LSTM Baseline: Input data was transformed into a 3D tensor of shape[batch_size, 60, 11] (where 11 represents the number of Lag Close features + technical indicators). The architecture consists of two consecutive LSTM layers with 128 and 64 hidden units, respectively. Each layer is followed by a Dropout layer (0.2) to mitigate the risk of overfitting. The dense output layer features a single linear unit. The model was trained using Huber Loss (to tolerate outliers), the Adam optimizer ($\eta = 0.001$), a batch size of 32, and an EarlyStopping mechanism with a patience of 15 epochs based on the validation loss.
* XGBoost Baseline: This decision-tree ensemble model was configured with the following parameters: n_estimators=500, learning_rate=0.05, max_depth=6, subsample=0.8, colsample_bytree=0.8, and a random_state adjusted for each run.
* Hybrid Stacking (LSTM → XGBoost): At Level 1, the LSTM Baseline model was trained to generate normalized BBRI stock price predictions. These Level 1 predictions were then combined with the original 65 input features on the test set. The concatenated feature set was subsequently fed into the Level 2 model (XGBoost meta-learner) configured with: n_estimators=600, learning_rate=0.03, max_depth=5, and a subsampling parameter of 0.8.
3.5. Performance Evaluation Scheme
The experiments were executed across 10 independent runs using dynamic random seeds (random_seed from 43 to 52). The primary evaluation metrics include:
Mean Absolute Error (MAE):* Measures the average magnitude of absolute prediction errors.
Root Mean Squared Error (RMSE):* Penalizes larger errors more heavily.
Coefficient of Determination ($R^2$ Score):* Measures the proportion of target variance explained by the model.
Mean Absolute Percentage Error (MAPE):* Represents the average percentage error relative to the actual values.
Subsequently, the squared residuals from the predictions of the three models on the test set were compared using the Wilcoxon Signed-Rank Test to establish statistical significance.
4. Results and Discussion
4.1. Quantitative Performance Metrics Analysis
The average performance evaluation results from 10 independent runs are summarized in Table 1:Table 1. Average Performance Comparison of BBRI Stock Prediction Models (10 Runs)
| Model | MAE (IDR) | RMSE (IDR) | $R^2$ Score | MAPE (%) | n |
|---|---|---|---|---|---|
| XGBoost Baseline | 126.1506 ± 4.5945 | 188.5673 ± 4.0398 | 0.8412 ± 0.0068 | 3.1385 ± 0.1263 | 10 |
| Hybrid Stacking | 128.6106 ± 6.6277 | 193.7625 ± 5.4648 | 0.8323 ± 0.0095 | 3.1868 ± 0.1862 | 10 |
| LSTM Baseline | 229.0273 ± 26.4501 | 301.6060 ± 30.9412 | 0.5901 ± 0.0808 | 5.5588 ± 0.6445 | 10 |
Note: Values are reported as mean ± standard deviation. Bold text denotes the best performance.
Based on Table 1, the XGBoost Baseline consistently yields the lowest error rates (MAE = 126.15 IDR; RMSE = 188.57 IDR) and the highest goodness-of-fit ($R^2$ = 0.8412). This is visualized in Figure 1:
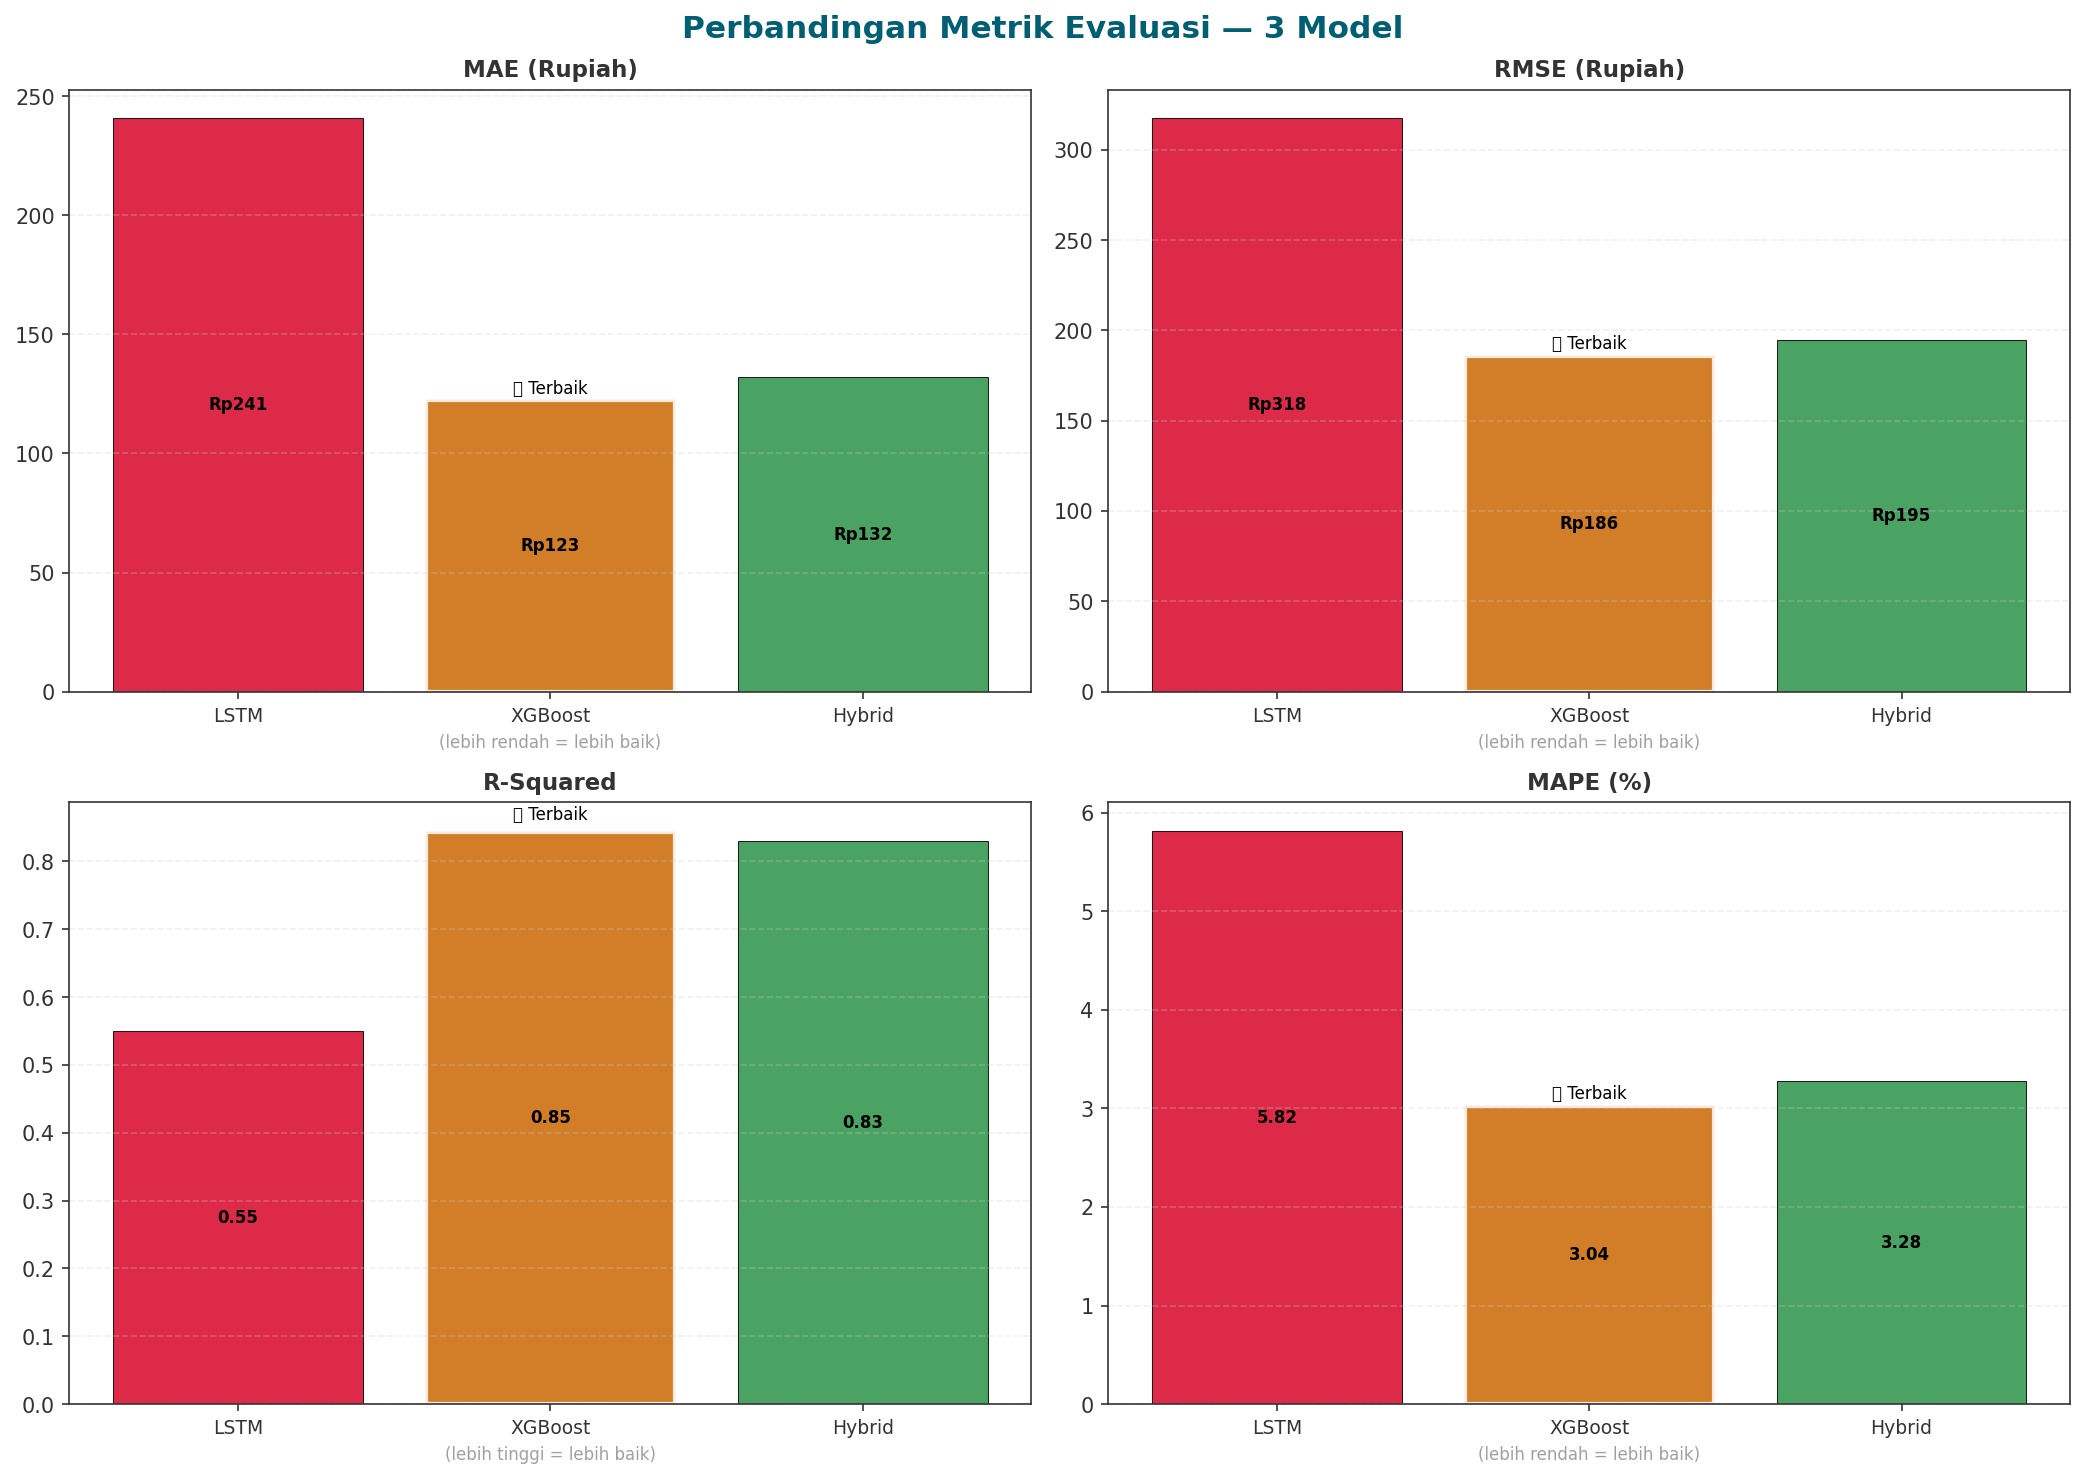
These results contest findings in some literature that assume sequential deep learning (LSTM) unconditionally outperforms conventional machine learning models on financial time series. The LSTM Baseline model exhibited the lowest performance with an MAE of 229.03 IDR and an $R^2$ of 0.5901, accompanied by a high standard deviation (26.45 IDR), indicating performance instability triggered by random neural network weight initialization.
The Hybrid Stacking model demonstrated highly competitive performance (MAE = 128.61 IDR; $R^2$ = 0.8323). Nonetheless, the hybrid model failed to outperform the single XGBoost baseline.
4.2. Visual Analysis of Predicted vs. Actual Price Movements
Figure 2 illustrates the comparison of predicted stock prices from the three models against the actual BBRI stock prices on the test set (2024–2025 period).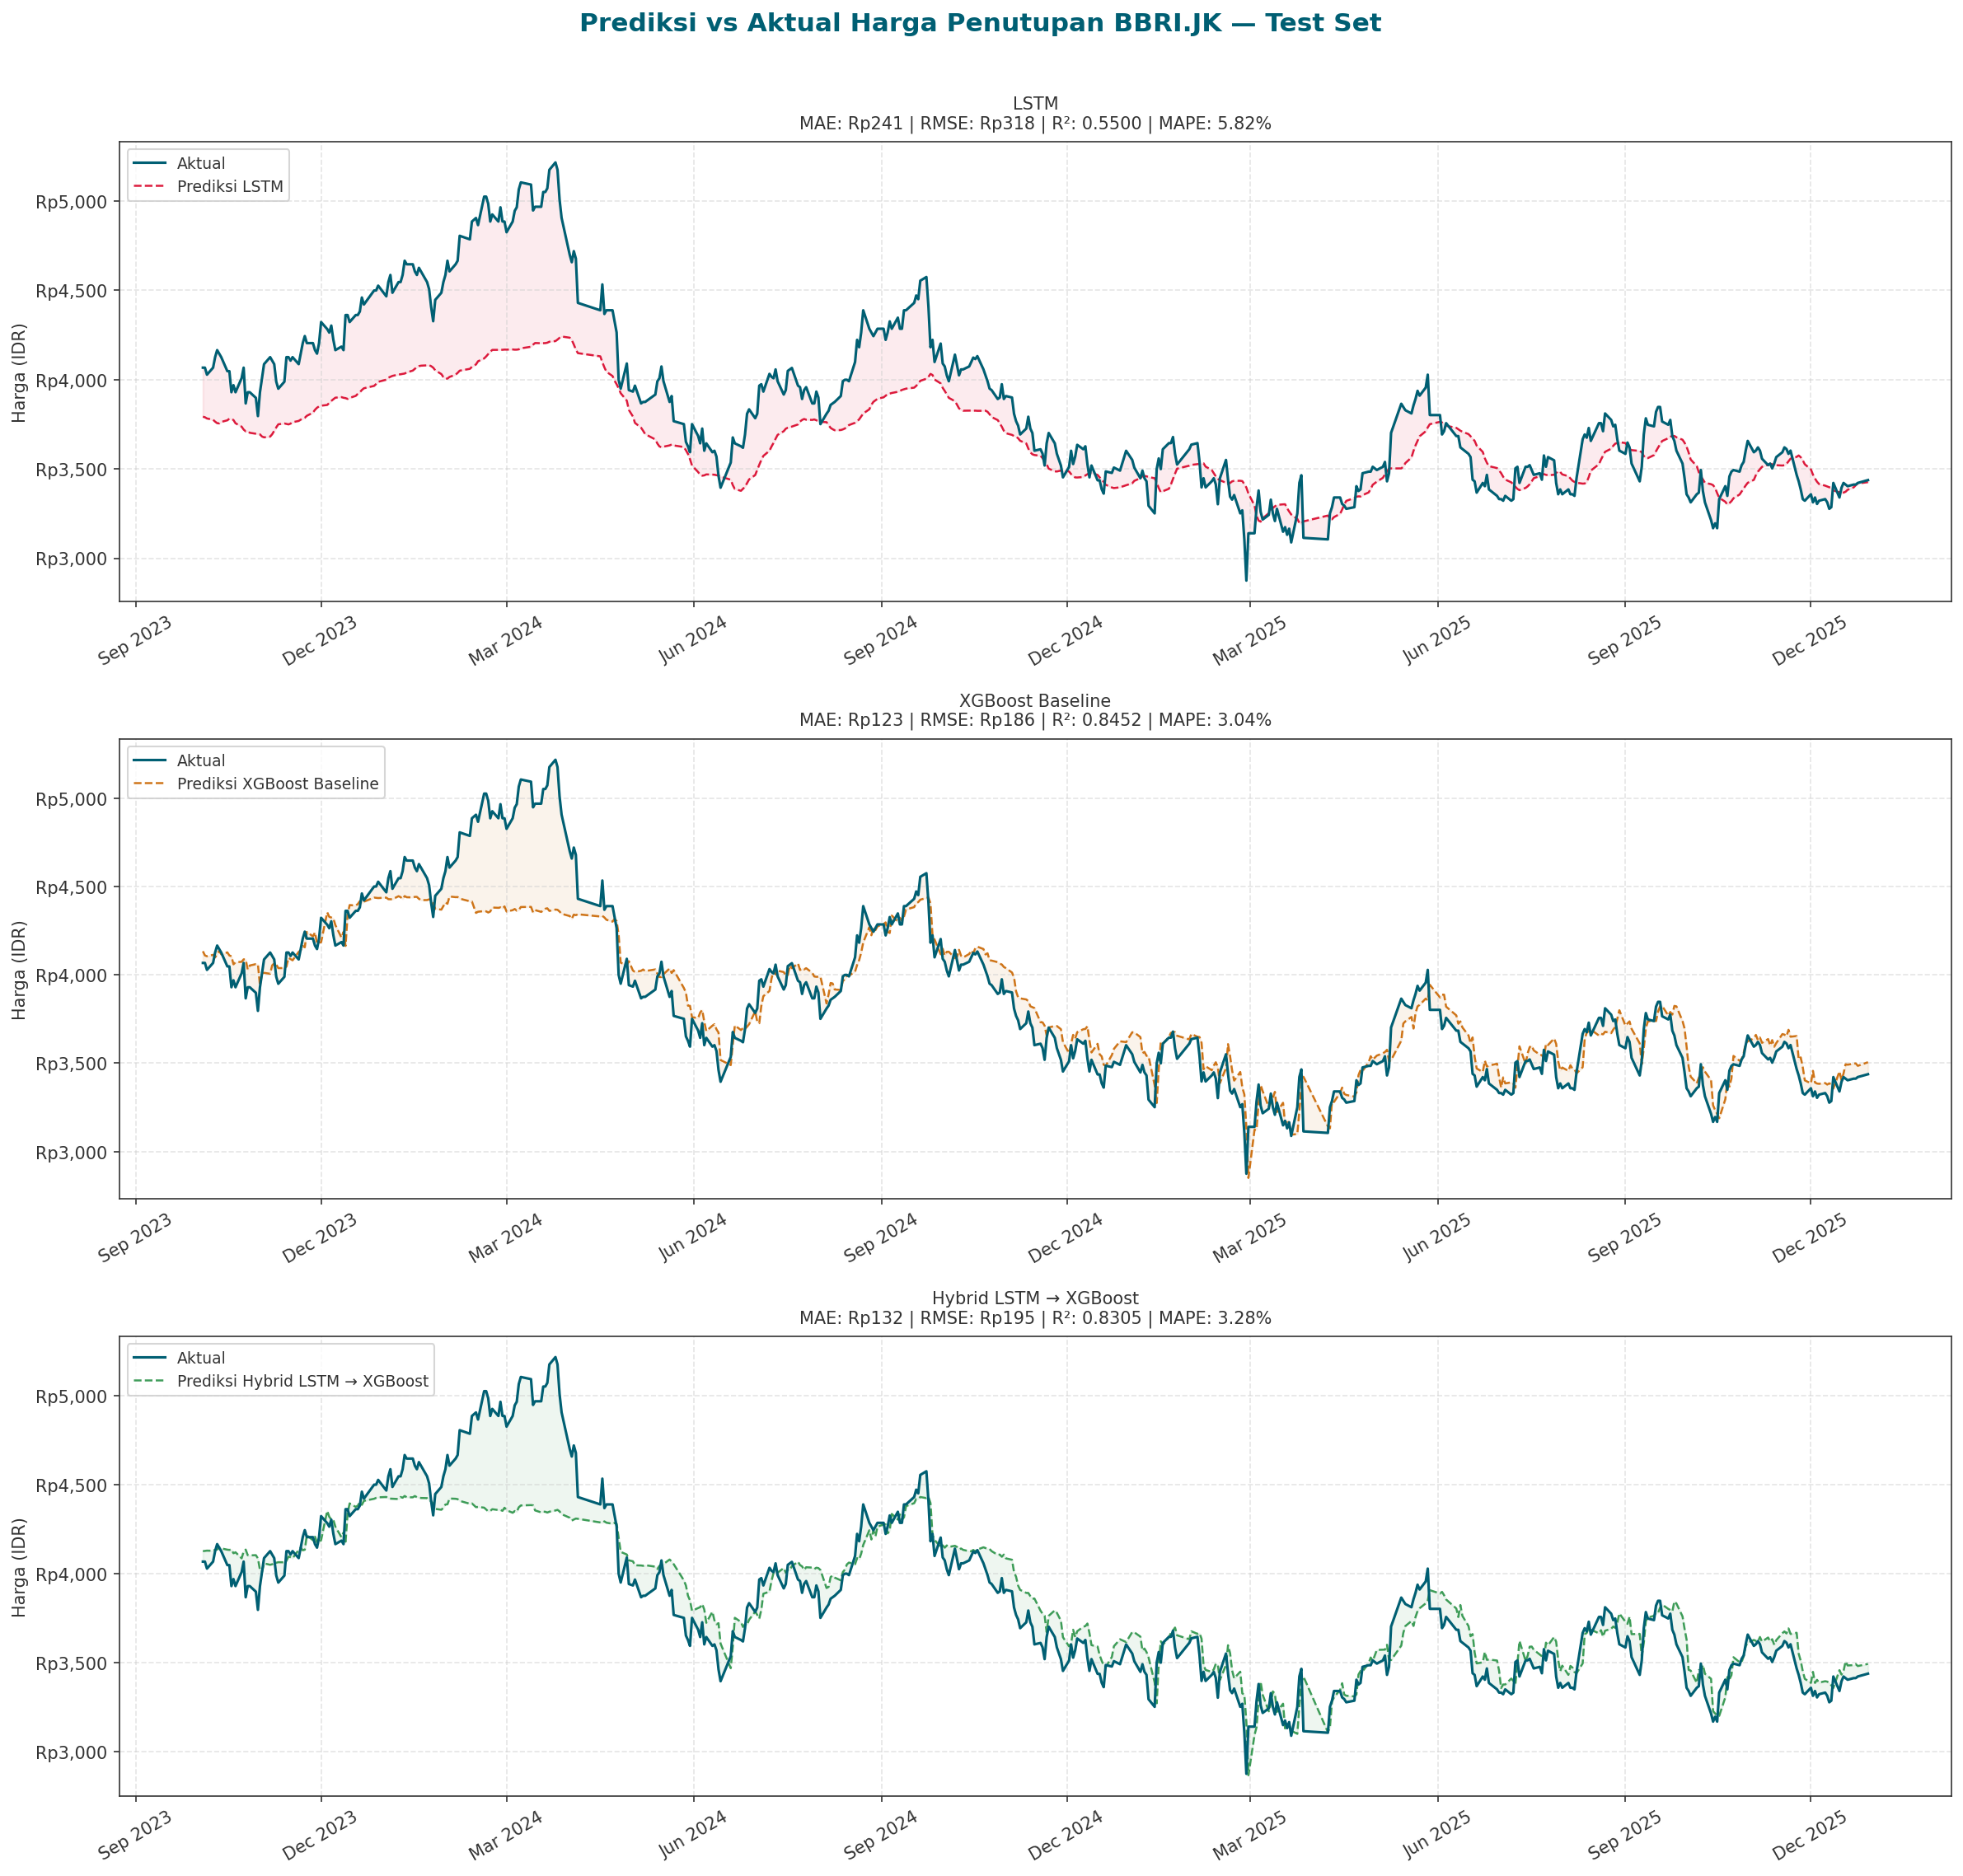
As shown in Figure 2, both XGBoost and Hybrid Stacking accurately track daily fluctuations and short-term trend reversals. Conversely, predictions from the LSTM Baseline suffer from a significant phase delay (time-lag bias), wherein the model frequently fails to predict trend reversals in a timely manner.
4.3. Statistical Significance Testing
To prove that the aforementioned performance differences are not statistical anomalies, we conducted a Wilcoxon Signed-Rank Test at a 95% confidence level. The test results are detailed in Table 2:Table 2. Wilcoxon Signed-Rank Test Results on Absolute Residual Errors
| Model Comparison | Test Statistic (W) | p-value | Conclusion |
|---|---|---|---|
| LSTM vs. XGBoost | 16559.0 | $3.65 \times 10^{-53}$ | SIGNIFICANT ✅ |
| Hybrid vs. LSTM | 18661.0 | $2.77 \times 10^{-49}$ | SIGNIFICANT ✅ |
| Hybrid vs. XGBoost | 61294.0 | $0.0056$ | SIGNIFICANT ✅ |
Since the p-values for all comparisons are below the significance threshold of $\alpha = 0.05$, the null hypothesis ($H_0$) is rejected. Consequently, it can be concluded that the performance differences among the three models are statistically significant. Effect size calculations using Cohen's d indicate a large effect size between XGBoost vs. LSTM ($d = -5.46$) and a medium effect size between XGBoost vs. Hybrid ($d = -0.43$).
4.4. Failure Analysis and Critical Discussion
The finding that the XGBoost baseline outperforms both the Hybrid Stacking and pure LSTM models contradicts Aprilia et al. [7], who reported that the hybrid LSTM-XGBoost model performed best for BBRI. This divergence in conclusions can be explained through a detailed failure analysis focusing on two main aspects:1. LSTM Sensitivity to Structural Breaks (Market Shocks):
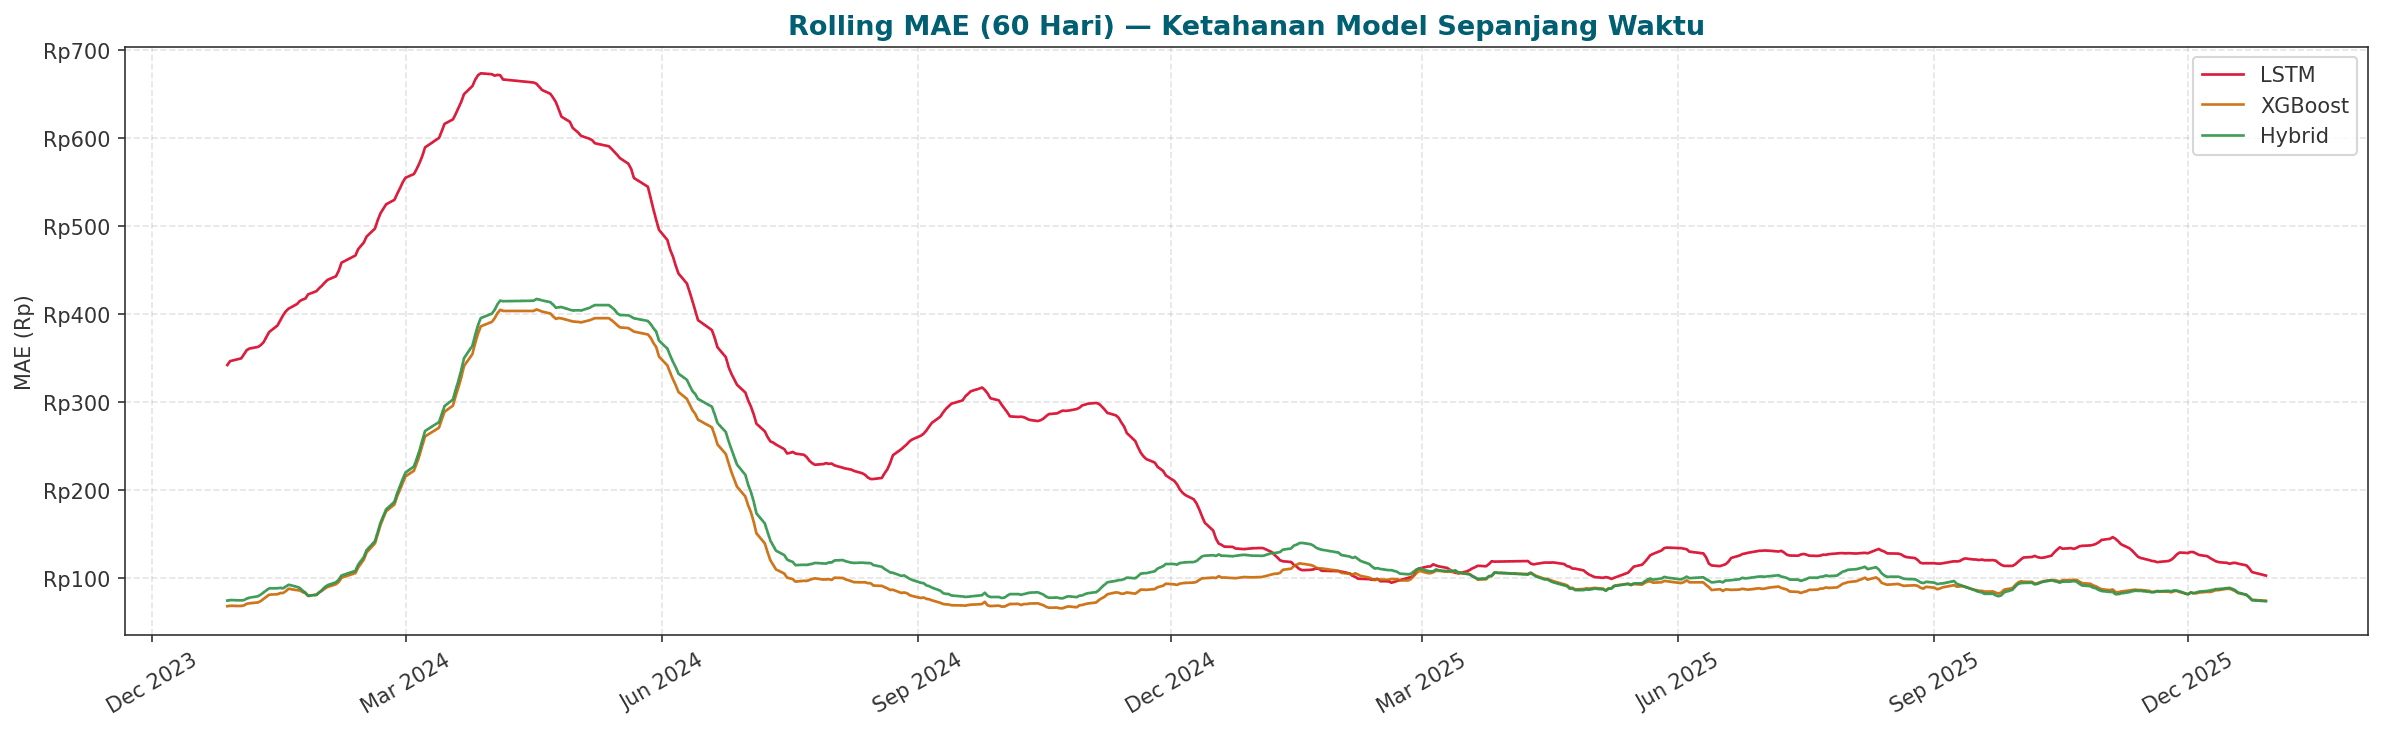
Deep learning models like LSTM require historical trend continuity to project future movements. During the observation period (2015–2025), BBRI stock experienced several sharp structural breaks, most notably during the COVID-19 pandemic (2020–2021), where the stock price plunged by over 40% in a short time before recovering. The long sequential memory of LSTM was distorted by these market crash patterns, causing the model to struggle in generalizing post-crisis market behavior accurately. This is confirmed by Figure 3, which visualizes the 60-day Rolling MAE:
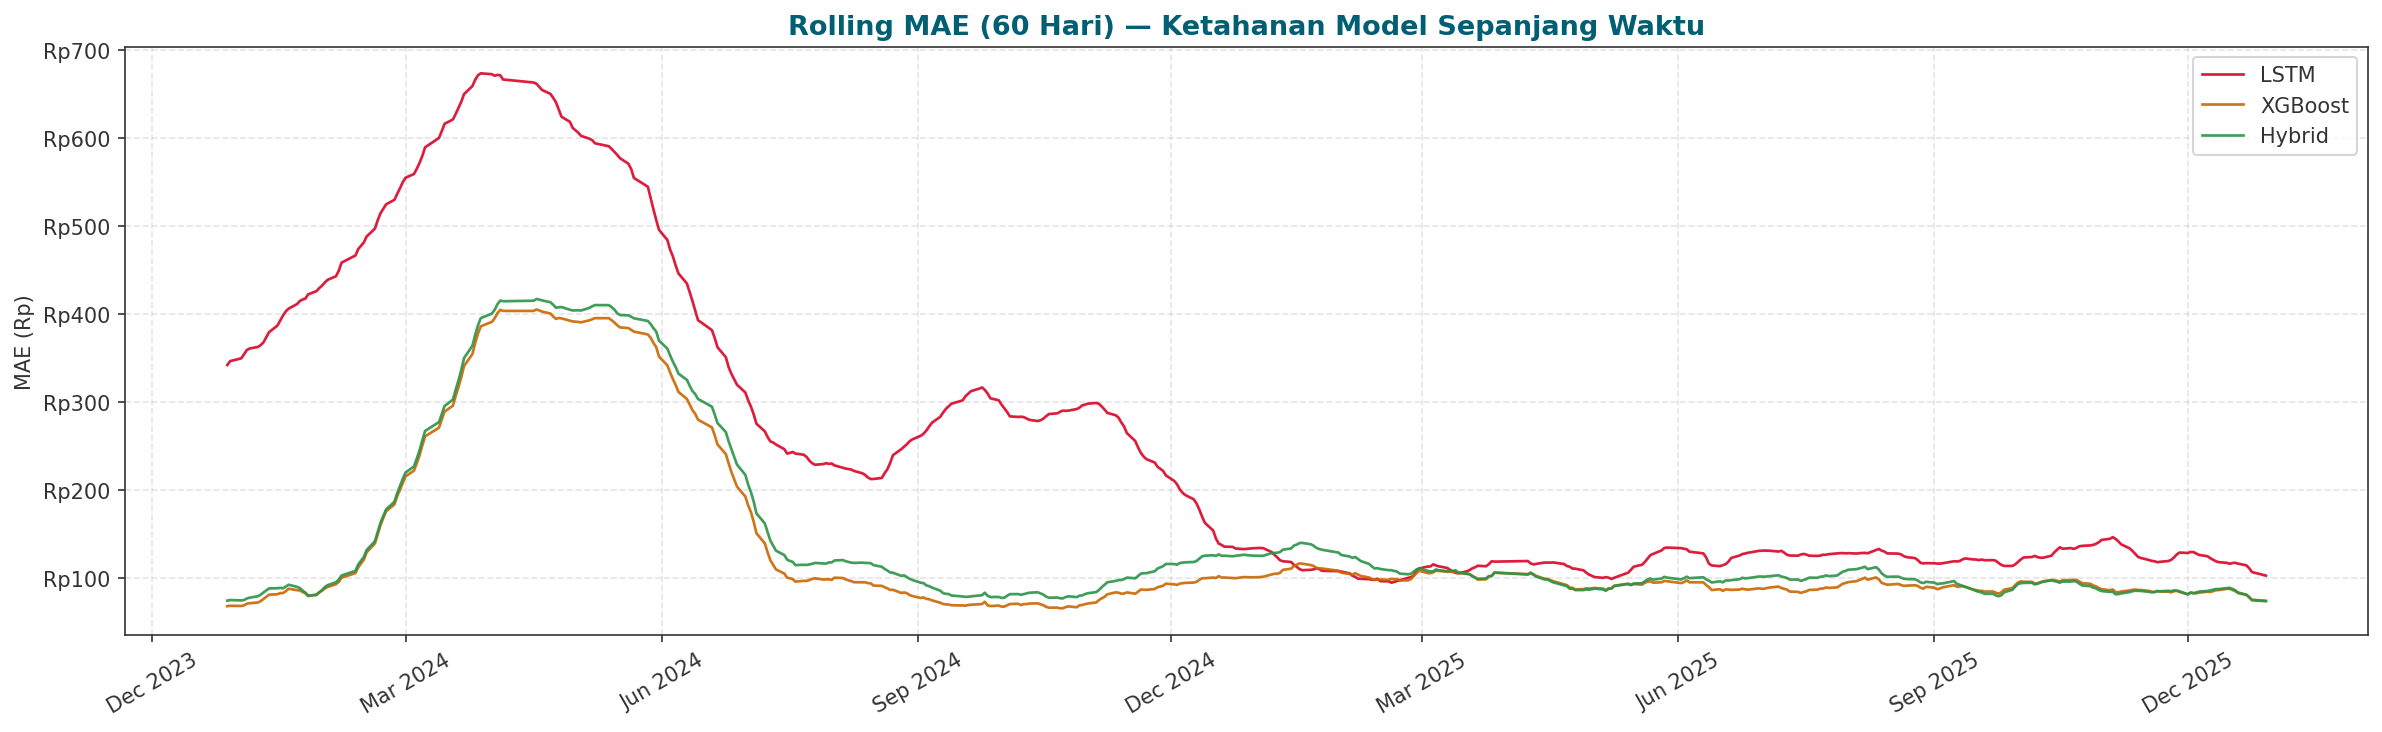
The Rolling MAE plot in Figure 3 shows that the error of the LSTM Baseline spiked dramatically during high-volatility periods and required a prolonged adaptation period to stabilize. Conversely, XGBoost, which relies on rule-based local partitions, is far more adaptive to volatility changes as it is not constrained by outdated long-term sequential patterns.
2. Noise Propagation in the Hybrid Stacking Model:
In the Level-2 Hybrid Stacking architecture, the scaled Close price prediction from the Level-1 LSTM is incorporated as a training feature for the Level-2 XGBoost meta-learner. However, since the Level-1 LSTM model produces high and unstable residual errors, these predictions act as additional noise for the meta-learner. Consequently, the Level-2 XGBoost model is forced to split its decision trees to compensate for the erroneous LSTM predictions, ultimately degrading its generalization capacity compared to the single XGBoost baseline.
Feature importance analysis of the XGBoost Baseline model (Figure 4) indicates that it heavily relies on the previous day's closing price (Lag_Close_t-1) and short-term volatility indicators such as ATR_14 and RSI_14 to dynamically map daily trends.
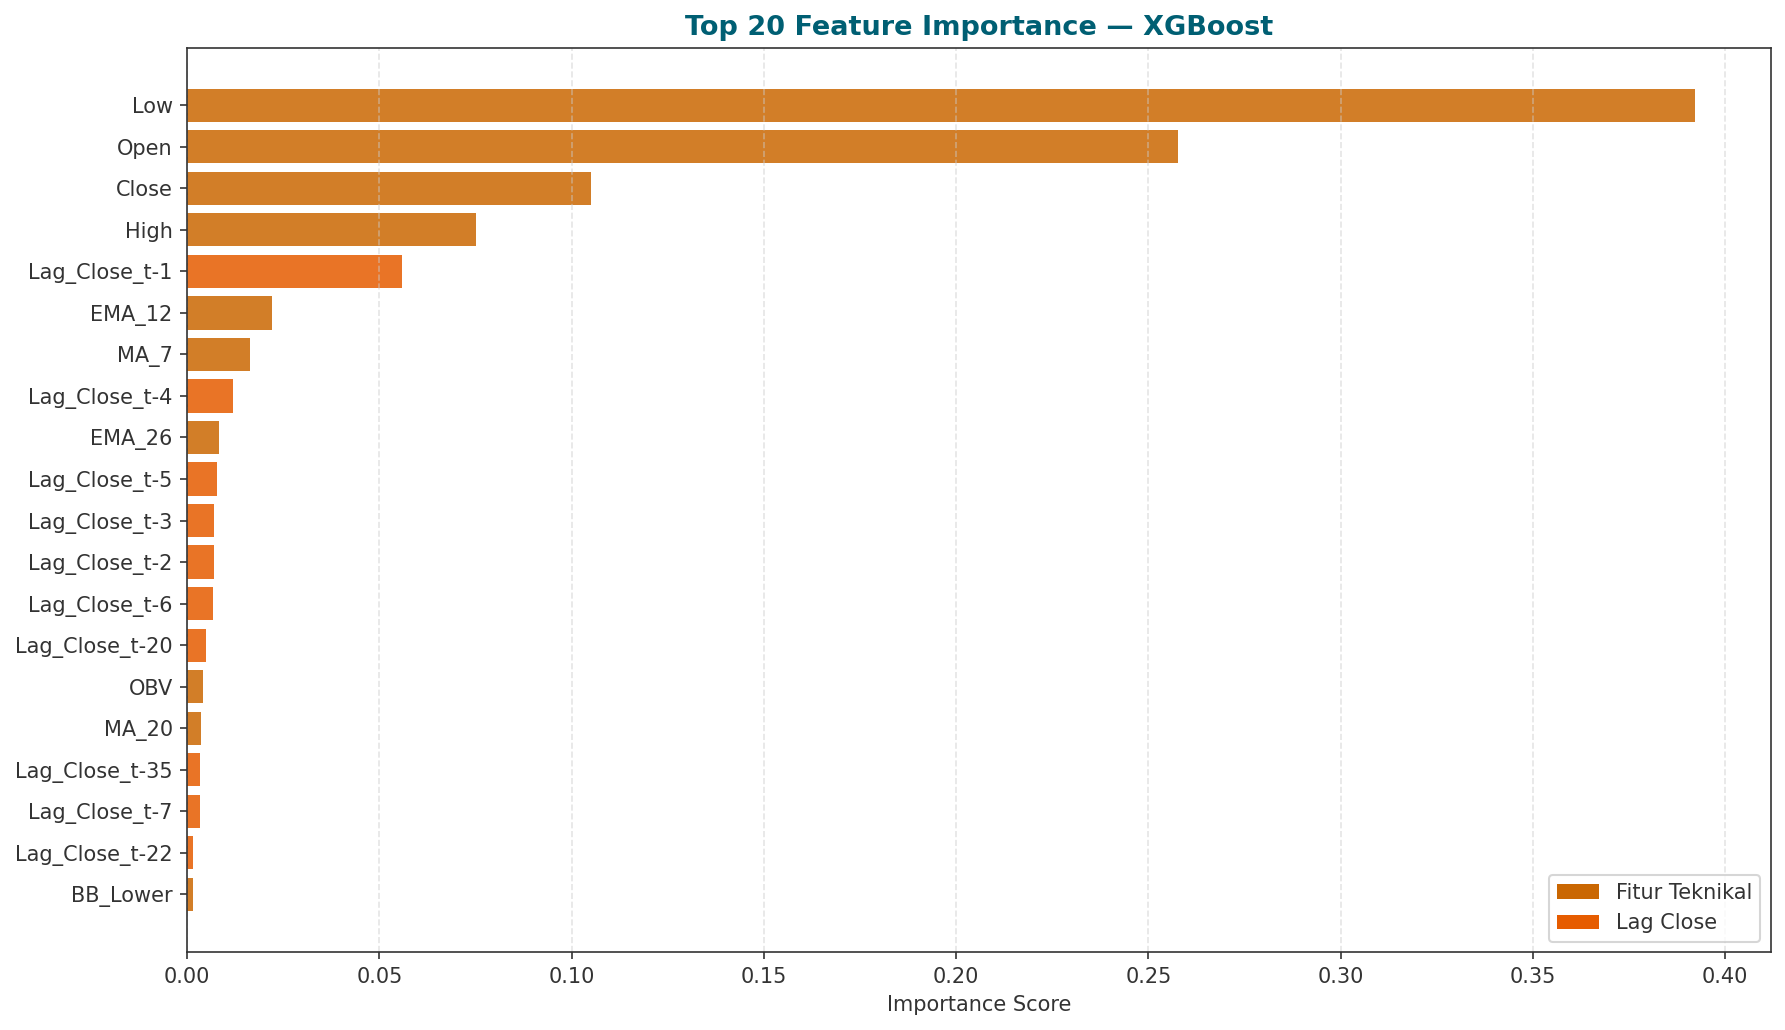
This explains why XGBoost, when combined with appropriate feature engineering, is far more robust than pure deep learning on financial time-series data characterized by high volatility and a limited daily trading sample size.
5. Conclusion
This study successfully evaluated and compared the performance of LSTM Baseline, XGBoost Baseline, and Hybrid Stacking models in predicting BBRI stock prices for the 2015–2025 period across 10 independent experimental runs. Empirical findings and the Wilcoxon statistical significance test conclusively demonstrate that the decision-tree-based ensemble model (XGBoost Baseline) yields the best and most stable performance ($R^2$ = 0.8412 ± 0.0068), outperforming both the Hybrid Stacking and LSTM Baseline models. The LSTM Baseline model exhibited the poorest performance and the highest error variability due to its sensitivity to noise and failure to handle market structural breaks such as the 2020 pandemic crisis. Furthermore, integrating LSTM predictions into the Hybrid Stacking model did not enhance accuracy due to transfer bias and noise propagation.For future research, it is recommended to:
1. Explore the use of attention mechanisms, such as Transformer architectures, to dynamically model temporal dependencies without being distorted by long-term structural breaks.
2. Integrate external unstructured data, such as financial news sentiment analysis and social media sentiment, to proactively anticipate market volatility.
3. Perform temporal cross-validation, such as walk-forward rolling window cross-validation, across other blue-chip stocks on the IDX to strengthen the external validity of the models.
References
1. Wardhana, R. G., Wang, G., & Sibuea, F. (2023). Penerapan Machine Learning dalam Prediksi Tingkat Kasus Penyakit di Indonesia. Journal of Information System Management (JOISM), 5(1), 40–45. doi:10.24076/joism.2023v5i1.1136. 2. Wibowo, A., & Isnain, A. R. (2025). Implementation of Machine Learning Algorithm for Environmental Sound Classification. MALCOM: Indonesian Journal of Machine Learning and Computer Science, 5(2), 616–625. doi:10.57152/malcom.v5i2.1712. 3. Ashari, Y., & Suhendar, A. (2024). Implementasi Algoritma Long Short-Term Memory (LSTM) Untuk Memprediksi Harga Beras Di Jawa Tengah Berdasarkan Cuaca. Djtechno: Jurnal Teknologi Informasi, 5(3), 624–636. doi:10.46576/djtechno.v5i3.5136. 4. Fauzan, R., Vitianingsih, A. V., Cahyono, D., Maukar, A. L., & Suprio, Y. A. B. (2025). Application of Classification Algorithms in Machine Learning for Phishing Detection. MALCOM: Indonesian Journal of Machine Learning and Computer Science, 5(2), 531–540. doi:10.57152/malcom.v5i2.1968. 5. Alkayes, A. F., & Sugihartono, T. (2025). Perbandingan Algoritma XGBoost dan LSTM dalam Prediksi Harga Saham Tesla Menggunakan Data Tahun 2025. Jurnal Pendidikan dan Teknologi Indonesia (JPTI), 5(6), 1563–1573. doi:10.52436/1.jpti.836. 6. Rosyd, A., Purnamasari, A. I., & Ali, I. (2024). Penerapan Metode Long Short Term Memory (LSTM) Dalam Memprediksi Harga Saham PT Bank Central Asia. JATI (Jurnal Mahasiswa Teknik Informatika), 8(1), 501–506. doi:10.36040/jati.v8i1.8440. 7. Aprilia, A. F., Saputra, W. S. J., & Adziima, A. F. (2026). Analisis Perbandingan Kinerja Model LSTM, XGBoost, dan Hybrid LSTM - XGBoost untuk Prediksi Harga Saham. Prosiding Seminar Nasional Sains dan Teknologi Seri V, 3(1), 1–10. 8. Kevin, Iskandar, R. J., & Tendean, S. (2025). Model Hybrid LSTM-XGBoost untuk Prediksi Nilai Tukar Rupiah Terhadap Dolar Amerika. MASITIKA (Jurnal Universitas Widya Dharma Pontianak), 10(1), 1–12. 9. Ulya, F. Z., Khomsah, S., & Tanjung, N. A. F. (2025). Perbandingan Algoritma XGBoost dan LSTM untuk Memprediksi Harga Bitcoin Berdasarkan Harga Harian, Sentimen, dan Google Trends Index. Jurnal Teknologi Informasi dan Ilmu Komputer (JTIIK), 12(6), 1271–1280. doi:10.25126/jtiik.2025126. 10. Indriyanti, P., & Fajriah, R. (2025). Kinerja Komparatif LSTM dan XGBoost untuk Peramalan Radiasi Matahari Perkotaan Tropis. FORMAT: Jurnal Ilmiah Teknik Informatika, 14(2), 245–252. doi:10.22441/format.2025.v14.i2.010. 11. Hochreiter, S., & Schmidhuber, J. (1997). Long short-term memory. Neural computation, 9(8), 1735-1780. 12. Chen, T., & Guestrin, C. (2016). Xgboost: A scalable tree boosting system. Proceedings of the 22nd ACM SIGKDD, 785-794. 13. Wolpert, D. H. (1992). Stacked generalization. Neural networks, 5(2), 241-259.Menyukai artikel ini?
Tags:
#Price Prediction, LSTM, XGboost, Hybrid Stacking